v0.32: Flex-config on graphs
Version v0.32 of FlexMeasures improves the UX of building dashboards with information in the flex-context and flex-model.
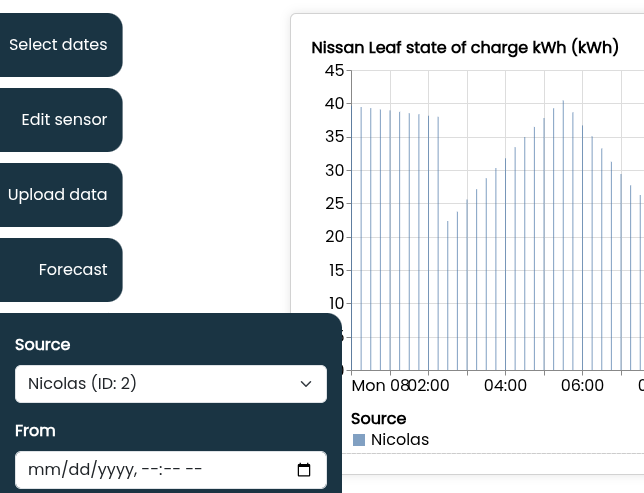
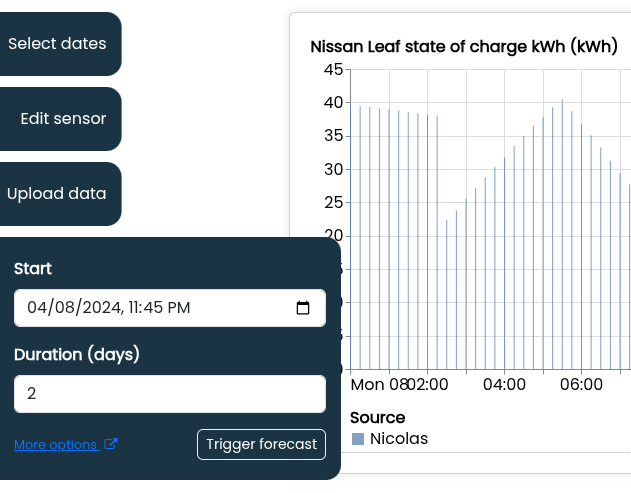
Also, we added functionality on the sensor page: a button to create forecasts and a button to delete data. Plus, the layout of actions on the sensor page is now nicer & more usable.
Here are some other notable features:
- improving hovering the data points on graphs
- switch dev environment to uv (faster installations)
- Annotations (see v0.31 how they look like in the UI) can be sent via the API
This release consists of around 30 PRs. See the changelog for a complete list of improvements.
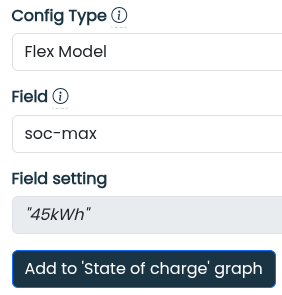
Flex config on graphs
We wrote about the flexibility configuration before. The flex-context and flex-model are cornerstones for FlexMeasures' ability to optimize any energy site. Until now, graph dashboards in FlexMeasures could be built with any sensor, but you would have to know which sensors are actually the ones influencing how FlexMeasures computes schedules.
Now, flex-context and flex-model a first-class citizens also when creating a dashboard. See here how that works:
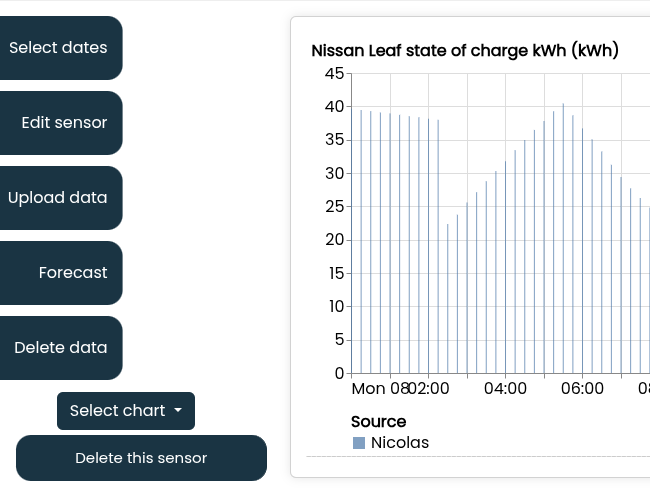
"Create forecasts" and "Delete data" on sensor page
The sensor page got a visual cleanup on the left side, where actions appear from the left. We added new actions (deleting data and adding forecasts) and as such the UX for the actions was getting difficult to navigate.