v0.11: Better data views

Version v0.11 of FlexMeasures adds much more useful data views, which are also customisable.
In addition, we completed the Docker-compose stack to include background job workers. This is very useful for developers.
See changelog or read on below to read what we added.
Data views
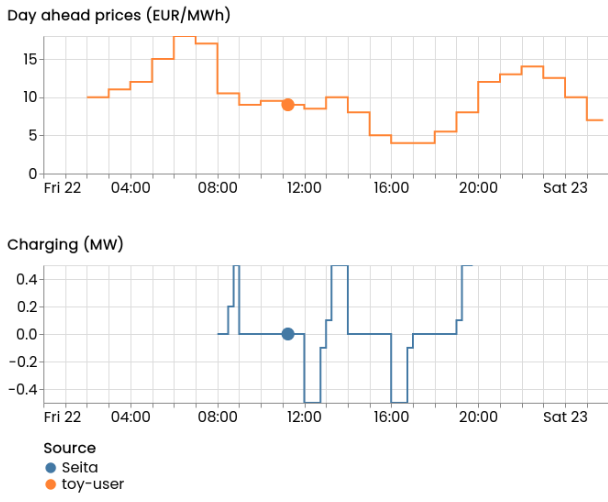
FlexMeasures is about optimising how your flexible assets are run. It's thus crucial to show the data in context. For instance, the charging schedule of an electric car should be shown together with what it's optimised against. In a project of ours, that is dynamic (hourly) prices. The asset page for the EV should show the prices, as well. The featured image of this blog entry shows this.
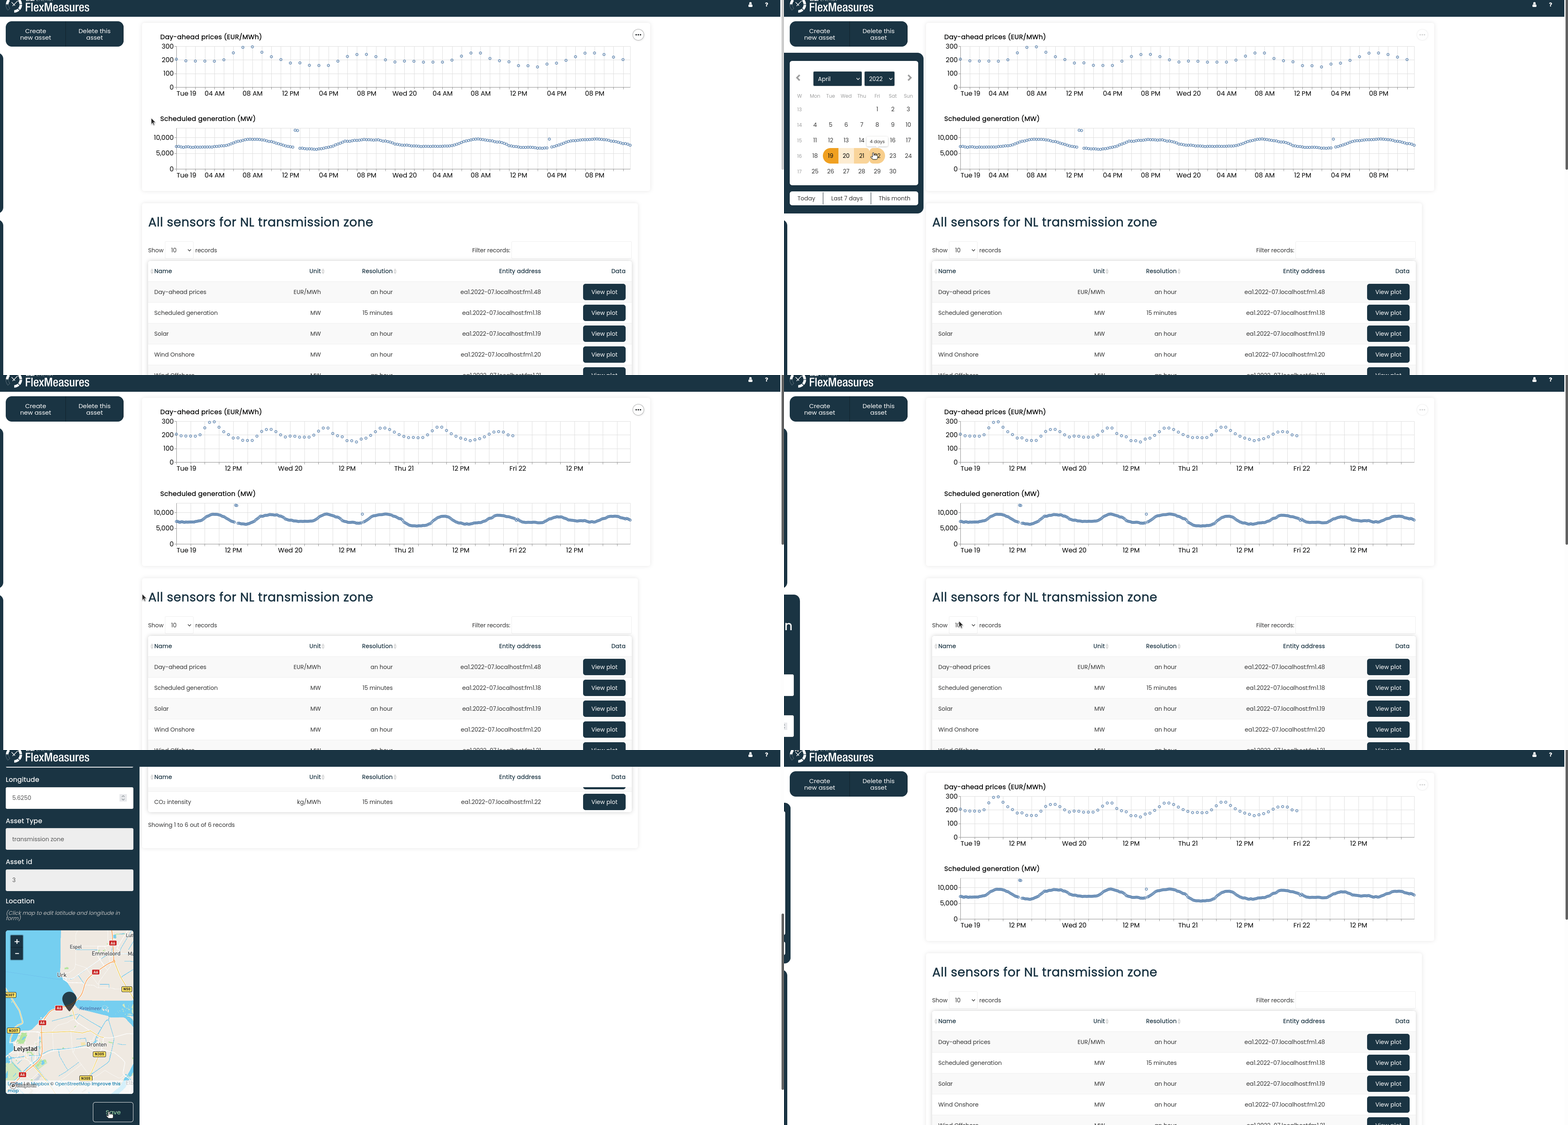
Also, we believe users want to concentrate on the data, therefore we moved the controls (date-picker, editing of asset attributes) out of the way.

There are numerous other additions for better data viewing, like better axis, tooltip and unit support in plots, remembering the selected date range across pages and the dashboard being able to group assets by accounts (not just type).
This work was done in Pull Requests 449, 467, 423, 446, 447, 474 and 475.
Full docker compose stack
You could tell from the last releases that we want to Dockerize FlexMeasures, so it becomes a first-class cloud citizen, but also that developers can get it to run locally with the least installation hassle.
The missing piece was that the Docker compose stack now also spins up a Redis database and a worker node for doing computations in a queue.
The docker-compose tutorial reflects this now.
This work was done in Pull Request 455.
Serving data in the resolution you need
When getting data out of FlexMeasures, you also might want a specific resolution. Hourly data is much lighter (if that is all you need) than 5-minute data, for instance.
We added a resolution parameter to the /sensors/data (GET) endpoint.
This work was done in Pull Request 458.