v0.15: Process scheduling & Heatmap
Version v0.15 of FlexMeasures brings the ability to schedule energy processes and adds a new data visualization: Daily activity heatmap. Finally, we add API support for managing sensors.
See changelog for a complete list or read on below about the larger new features we added.
Scheduling energy processes
FlexMeasures' in-built device scheduler works best for storage devices like batteries or heat buffers, which can have any flow. We sometimes encounter situations where the flexibility lies in a steady process, which has to happen during some time window. Usually, this is a feature in process-heavy industry settings like water purification or paper manufacturing.
We have now added the process scheduler to be used in such scenarios. Let's say you need a process which takes 45 kW of power, and it needs to run 14 hours before tomorrow ― you have 10 hours of flexibility! Given some cost signal (like prices, or CO2), you can tell FlexMeasures to find the best running times.
Here is an overview of what you can tell FlexMeasures about your process optimization needs (this is the flex model):
power: nominal power of the processduration: time that the process lastsoptimization_sense: objective of the scheduler, to maximize or minimizetime_restrictions: time periods in which the load cannot be schedule toload_type: Inflexible, Breakable or Shiftable
Note the load_type:
Plus, in the flexibility context, you can (as usual) add a consumption-price-sensor.
This scheduler is available through the API when you trigger a new schedule for a sensor on an asset with type "process" or "load".
We also made a CLI command for computing schedules like this:
flexmeasures add schedule for-process
--sensor-id 4 --process-type SHIFTABLE--start 2023-07-23T00:00:00+01:00
--duration PT24H --process-duration PT4H --process-power 0.4MW--consumption-price-sensor 2
--forbid '{"start": "${TOMORROW}T14:00:00+02:00", "duration" : "PT1H"}'
We documented usage of this new scheduler in a tutorial.
This work was done in Pull Requests 729, 768, and 777.
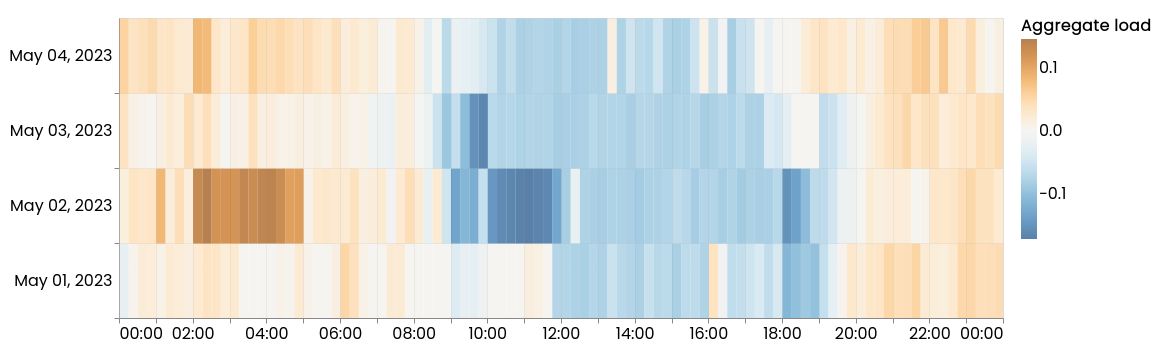
New data visualization: Daily activity heatmap
Heatmaps are great ways to spot the hotspots of activity. Usually heatmaps are actually geographical maps. In our context, the most interesting background is time ― so we'd like to see activity hotspots on a map of time intervals.
We chose the "time map" of weekdays. From our experience, this is where you see the most interesting activity hotspots at a glance. For instance, that mornings often experience peaks. Or that Tuesday afternoons have low energy use, for some reason.
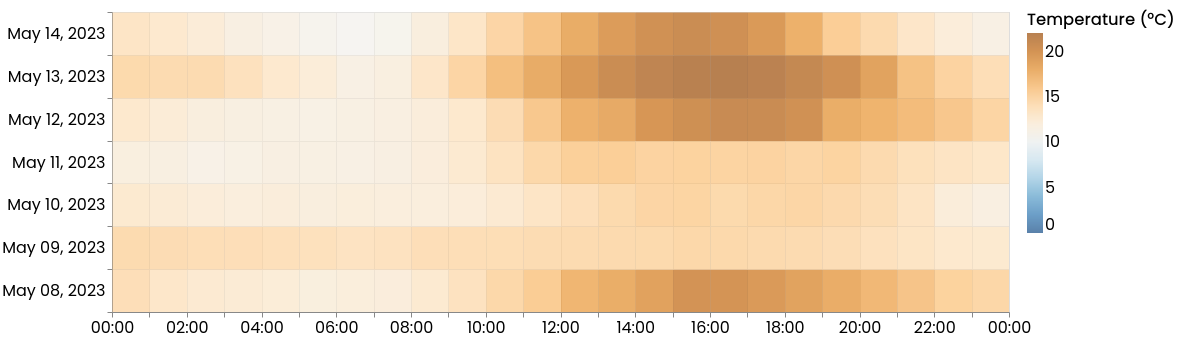
Here is how it looks like for one week of temperature data:
And here are 4 days of (dis)-charging patterns in Seita's V2GLiberty project:
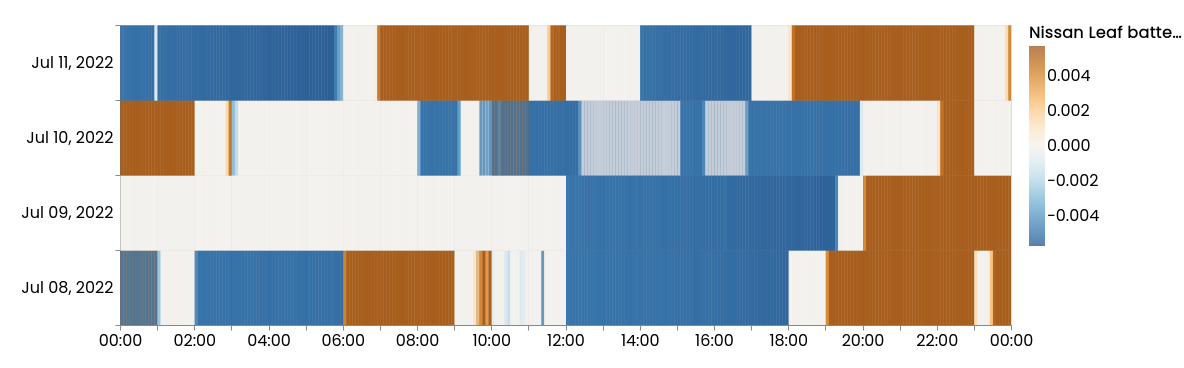
So on a technical level, the daily heatmap is essentially a heatmap of the sensor's values, with dates on the y-axis and time of day on the x-axis. For individual devices, it gives an insight into the device's running times. A new button lets users switch between charts.
This work was done in Pull Request 715.
Manage sensors in API
Until now, it was possible to work on assets via the FlexMeasures API, but it had no CRUD capabilities for sensors. We now added GET, POST, PATCH and DELETE endpoints, so talking to FlexMeasures from the outside becomes more powerful. Custom frontends or installations using the FlexMeasures Client can fully build up complete asset-sensor structures on their own (the client will be updated to reflect this soon).