v0.16: ProfitLoss Reporter

Version v0.16 of FlexMeasures advances the state of art on reporting by offering a very useful implementation (and a tutorial how to bring it to practice). We also add a command to get charts via the CLI and add capacity limits as a field in the flex context.
See changelog for a complete list or read on below about the larger new features we added.
ProfitOrLoss reporter & Tutorial
Reporting capabilities were introduced in v0.14. We are continuing to make it more useful. We already made it possible to have a reporter aggregate sensors (AggregatorReporter) or use Pandas methods on sensor data (PandasReporter) ― this had a lot of power so KPIs could be made.
In this version, we added an implementation that should cover a use case right off the shelf for almost everyone using FlexMeasures: a reporter to compute how profitable your operation has been (ProfitOrLossReporter). Showing the results of optimization is a crucial feature, and now easier than ever.
We also wrote a tutorial for using it in your installation. Here are some excerpts (note that that tutorial also shows other reporting types).
First, reporters can now be stored as data sources, so they are easy to be used repeatedly and the data they generate can reference them. Our data source has "ProfitOrLossReporter" as model attribute and these attributes (the least a ProfitOrLossReporter needs to know is a price):
{
   "data_generator": {
     "config": {
       "consumption_price_sensor": 1
     }
   }
}
And here is excerpts from the tutorial in how to configure and create a report:
$ echo "
$ {
$     'input' : [{'sensor' : 4}],
$     'output' : [{'sensor' : 9}]
$ }" > profitorloss-parameters.json
The input sensor stores the power/energy flow, and the output sensor will store the report.
$ flexmeasures add report --source 6 \
   --parameters profitorloss-parameters.json \
   --start-offset DB,1D --end-offset DB,2D
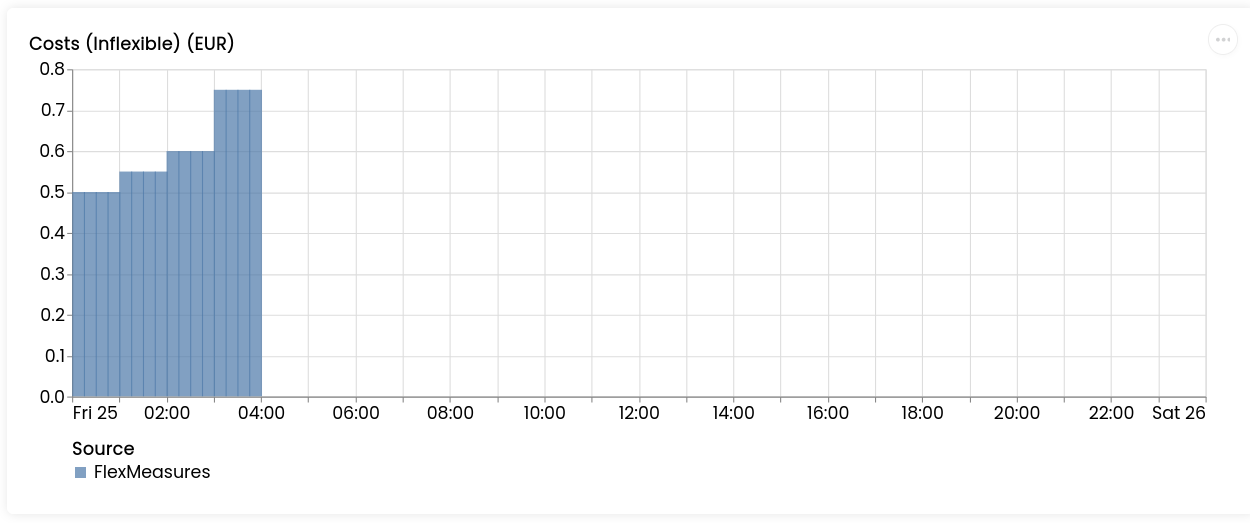
With these offsets, we indicate that we want the report to encompass the day of tomorrow (see Pandas offset strings). The chart below then shows all costs which we know will be made tomorrow by the simple process scheduler in the tutorial.
This work was done in Pull Requests 808, 825, and 818.
Charts via the CLI
For documentation purposes, generating charts is sometimes very useful. For instance, we might want to send a chart to a client (in lieu of them having an account set up and us sending a link to the chart). Or we are supposed to create a Word document.
The new command flexmeasures show chart can export sensor and asset charts.
Here is an example:
flexmeasures show chart --start 2023-08-15T00:00:00+02:00 --end 2023-08-16T00:00:00+02:00 --asset 1 --sensor 14 --sensor 15 --filename 'chart-$now-$entity_type-$id.png'
This work was done in Pull Request 833.
Capacity limits as a field in the flex context
The limit to a storage device or the grid connection are crucial information for FlexMeasures' algorithm. The way this could be encoded before was not very user-friendly (as asset or sensor attribute). We have now added the fields storage_power_capacity_in_mw and ems_power_capacity_in_mw, respectively, so that the flex model can encode this explicitly (the flex model can be sent to the API when triggering schedules and soon be stored on the asset itself).
This work was done in Pull Requests 850.