v0.2.2: Github, compare plots & asset API

Version v0.2.2 of FlexMeasures is the first one to live publicly on Github. This was a huge step for our team!
But there were also some other notable improvements:
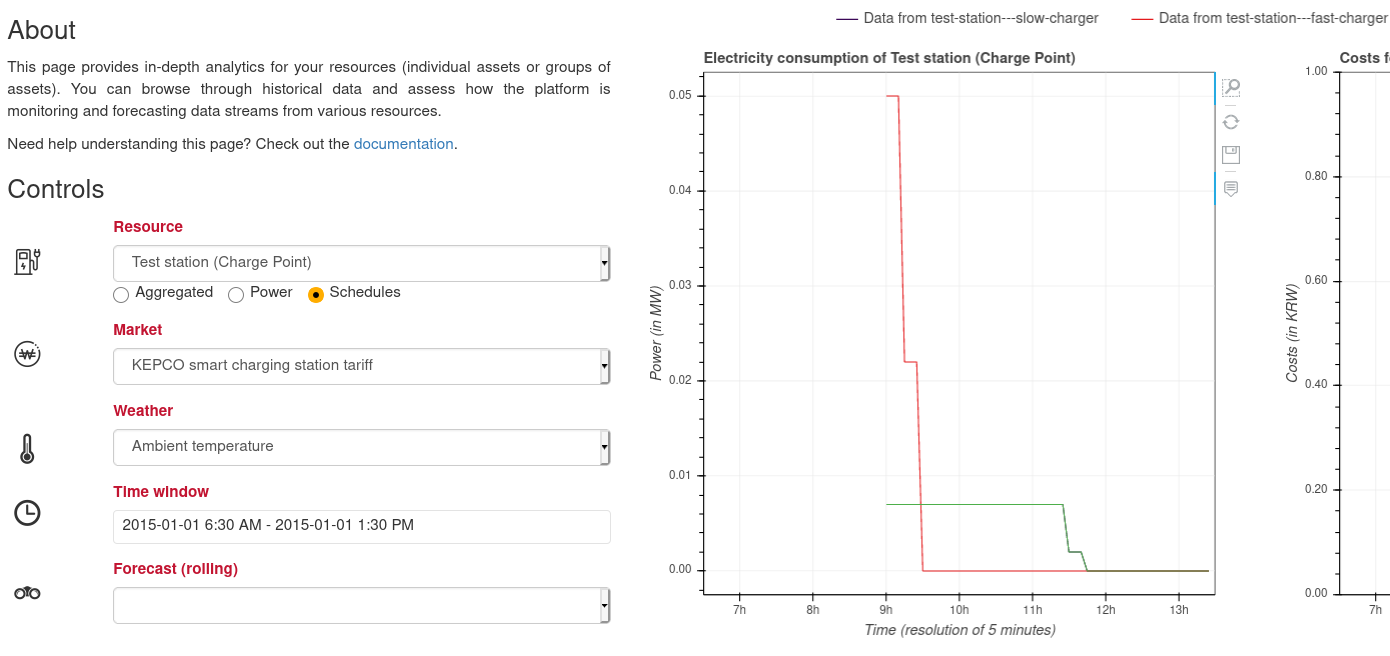
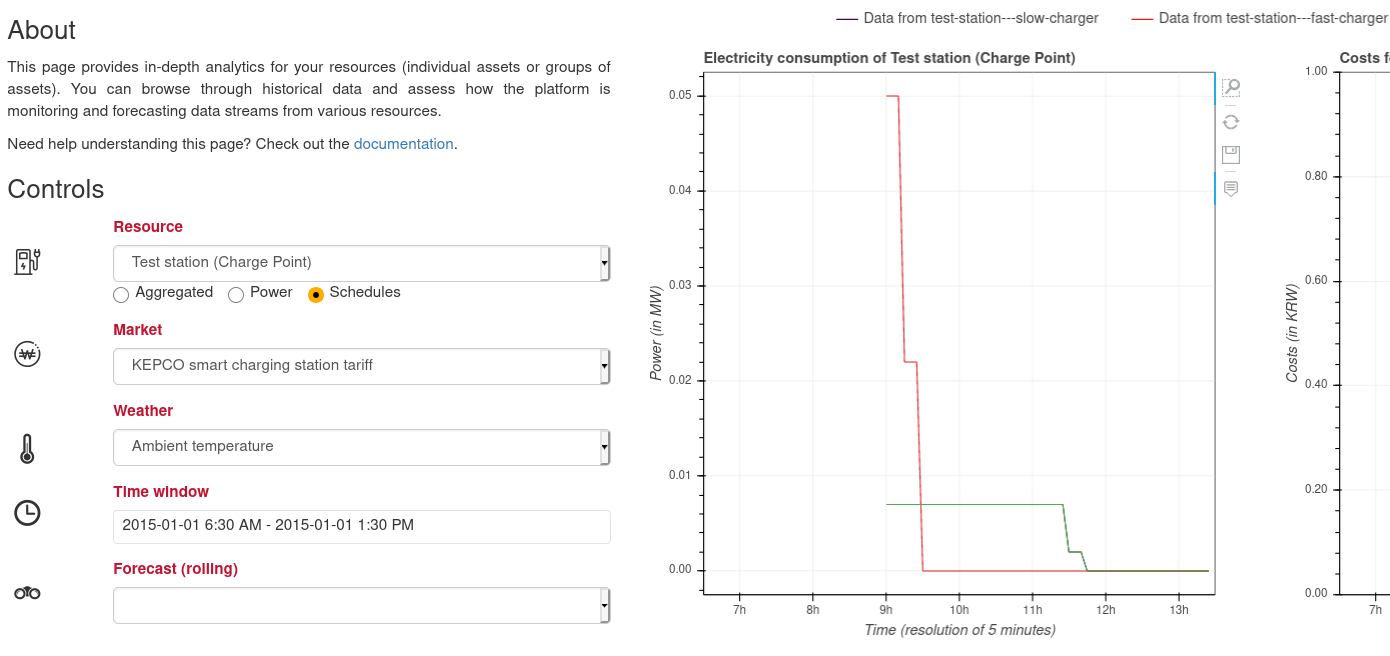
Plot power measurements or schedules individually
A powerful plotting feature for FlexMeasures, if comparing performance of assets is of interest. It is now possible to compare several assets in one plot. this works for both measurements or schedules. Here is an example:

This work was done here.
Asset management via the API
Since version 0.2.2, assets can be managed via the FlexMeasures API.
This can be useful for third-party development, in order to
- provide an overview over owned assets
- add or delete assets
- work on asset attributes like capacity or state of charge
We released this within version 2.0 of the FlexMeasures API, see here for more details on the endpoints.
This work was done in this commit.