v0.2.3: User API, Power chart API, better icons
Version v0.2.3 of FlexMeasures is out (see changelog). Aside from smaller improvements, there's new features in the API and the dashboard map.
User management via the API
Since version 0.2.3, users can be managed via the FlexMeasures API.
This can be useful for third-party development, in order to
- provide an overview over users
- work on user attributes like email, timezone or active status
- reset their password
Creation and deletion of users is still handled in the back office.
We released this within version 2.0 of the FlexMeasures API, see here for more details on the endpoints.
This work was done in Pull Request 25.
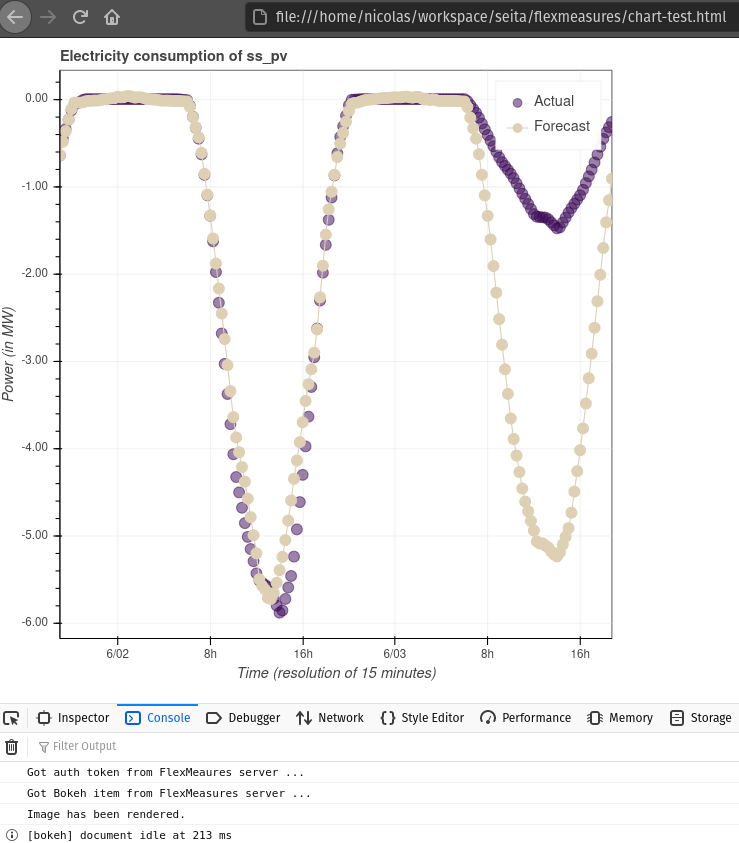
Power charts available via the API
Another feature third-party developers ask for is support in plotting. We have big plans in this regard, for a powerful chart API so developers can plot the data they need and even dynamically load more data.
For now, we started the road to this support already with the endpoint GET /api/v2_0/charts/power, which loads a power chart. See it in action below:
This work was done in Pull Request 39.
Better visibility of asset icons on maps
We improved map styling by putting map icons on top of markers and we also added a hover tooltip.
This work was done in Pull Request 30.