v0.28: Daily KPIs, faster graphs
Version v0.28 of FlexMeasures brings the ability to show daily KPIs above the graphs. Also, we improved the performance of viewing graphs.
Plus, a lot of small tweaks have happened!
See the changelog for a complete list of improvements.
Daily KPIs
Until now, FlexMeasures would only let you see graphs data. We do have a reporting engine, but you have to know it is there (one tutorial does help you use it) and showing that data is your own job.
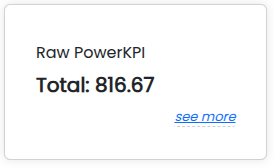
Now, we make the first step for such data to step into the light - daily KPIs (e.g. daily energy costs) can be shown above the graphs:
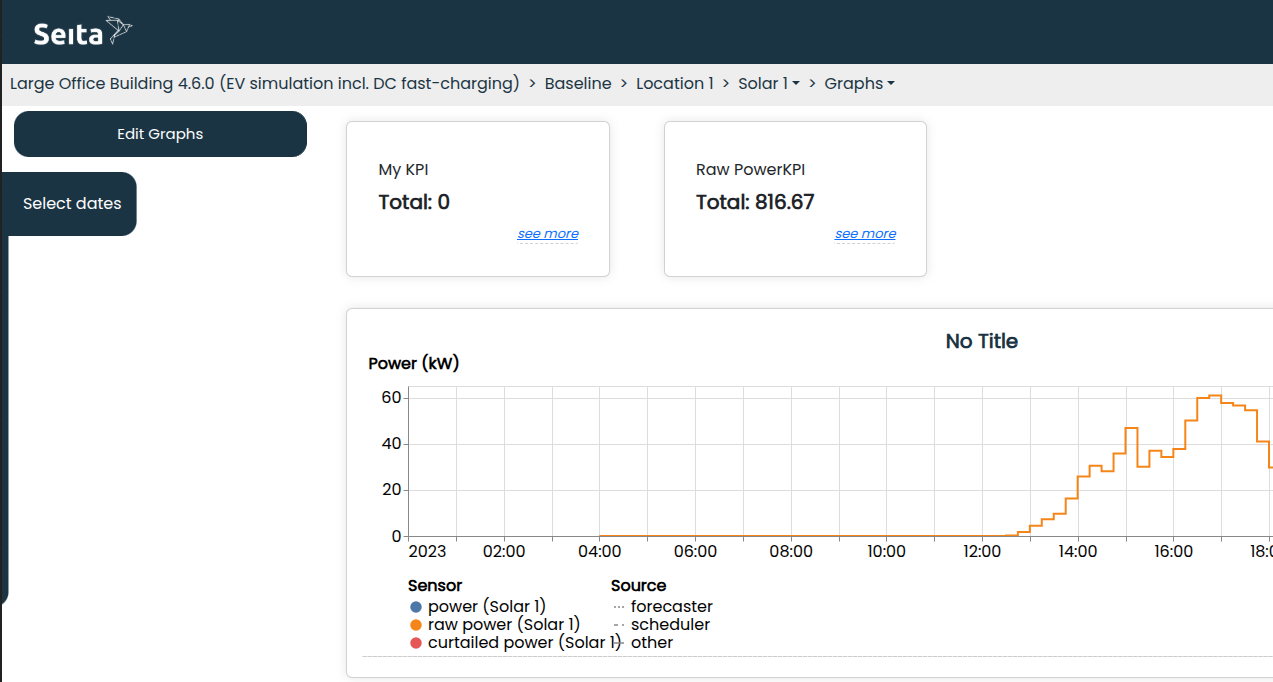
This is the way to configure such KPI widgets at the moment:
[ {"title": "My KPI", "sensor": 2, "function": "sum"}, {"title": "Raw Power KPI", "sensor": 3, "function": "sum"}]
The function setting can be either "sum", "mean", "max" or "min". We are working on a graphical way to set these soon. Until then, see this documentation on how to use htis feature.
This work was done in Pull Request 1608, 1656 , 1633 and 1634
Faster graphs page
The graphs page is very important to check in on a site, especially if it is new. It had some UX problems, which we fixed in JavaScript, as well as some data processing problems in the backend when loading graph data, which we fixed there.
As a result. waiting for data to load should be taking less time, and larger data set can be viewed.