v0.31: Forecasting API & data annotations

Version v0.31 of FlexMeasures adds API endpoints to control forecasting and (brings back) visual annotations on time series data.
Here are other notable features:
- Schedules can now be returned in a custom resolution
- The upload form (on the sensor page is improved): allow uploading data with different units (different resolution already supported), data can have gaps and better error handling
- Step-by-step replay in graphs
- The SwaggerUI API page can now be customized (incl. link to signup page)
- The 2FA code form (step of login) has improved UX
- JSON attributes (on assets, sensors) are now searchable (by code)
- Python3.9 has been deprecated
- We started using Copilot agents in PRs (for development)
As you can tell by this long list, this release lingered a bit to long and has >60 PRs! So this is worthy of upgrading ... See the changelog for a complete list of improvements.
Forecasting API
Forecasting is crucial to FlexMeasures' main purpose (which is scheduling). The new forecasting pipeline in v0.30 was only available via the CLI, however. That is fine for running forecasting in cron jobs, but we heard from users they would like to control forecasting from their scripts - and also client scripting uses the API.
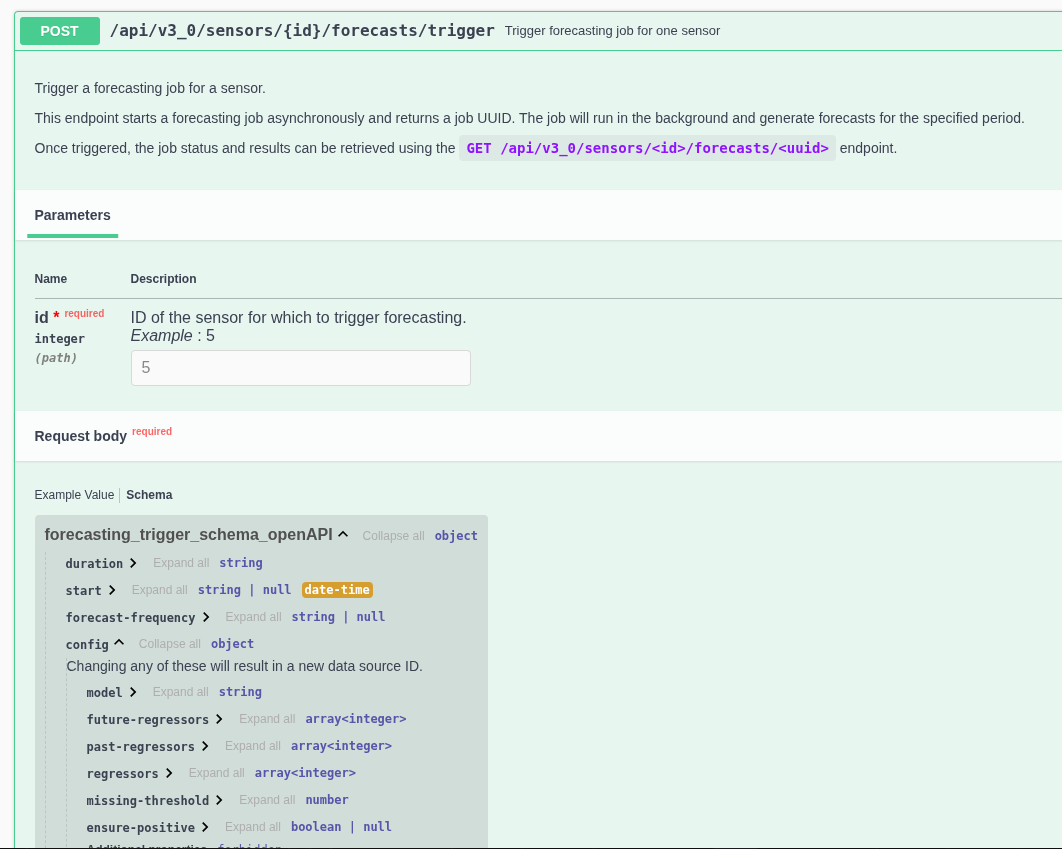
We took some time to design the API for this, as it should be both powerful but also simple to use if one wants a straightforward forecast.
This work was done in several pull requests.
Annotations
In the FlexMeasures design philosophy, we believe it is not enough to show & use time series data. It can matter very much who said it, and when.
But even after the data is in the platform, people might have something to say about it. Label it, if you will. Examples can be that an operator describes why an asset misbehaved that morning, or we can label a set of prices as coming from a manual upload.
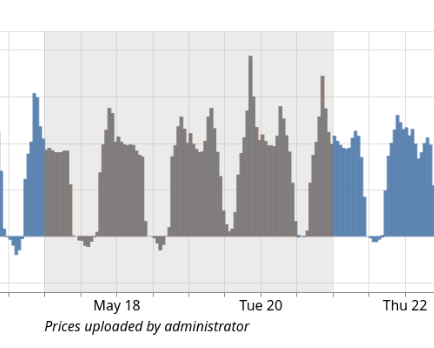
Annotations on the sensor page graph have been fixed and improved (they did exost before, but were not very usable). They behave better on hover, they appear in order during playback and they can overlap.
This work was done in Pull Request 1967.
We are currently working on supporting the addition of annotations better in the API.