FOSDEM 2024: a hands-on integration tutorial (video)
At FOSDEM 2024, there was an energy devroom again (2nd time). As we talked about using FlexMeasures in an open vehicle-to-grid (V2G) stack last time, we wanted to be a…
At FOSDEM 2024, there was an energy devroom again (2nd time). As we talked about using FlexMeasures in an open vehicle-to-grid (V2G) stack last time, we wanted to be a…

Version v0.19 of FlexMeasures has a few minor improvements, each of which might mean a lot to someone. We'll focus on our first steps into nested asset structures, as it…

Version v0.18 of FlexMeasures advances the modeling of the flex optimization problem, adding more detail. If we have knowledge about future conditions and underlying physics, our optimization gets better when…

Version v0.17 of FlexMeasures lets you elevate some accounts to be consultants of other accounts. It also increases robustness of scheduling, by using fallbacks. And a new favicon! See changelog…

Version v0.16 of FlexMeasures advances the state of art on reporting by offering a very useful implementation (and a tutorial how to bring it to practice). We also add a…
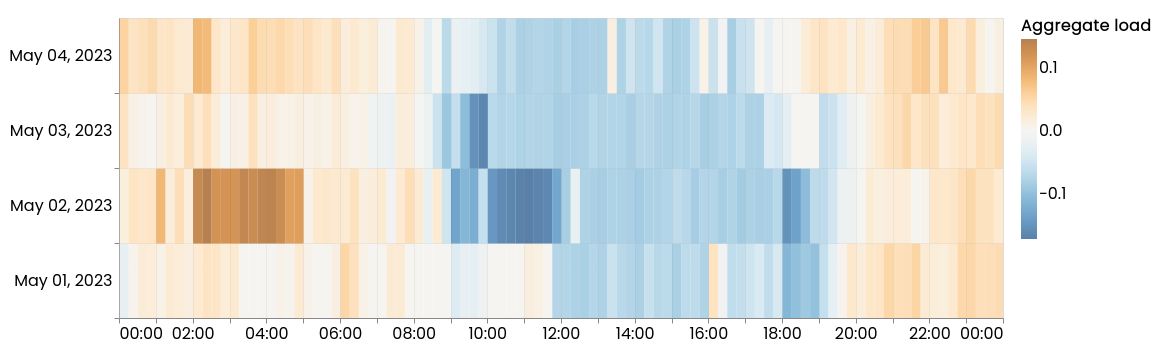
Version v0.15 of FlexMeasures brings the ability to schedule energy processes and adds a new data visualization: Daily activity heatmap. Finally, we add API support for managing sensors. See changelog…